Attention
This is the documentation for HARP Proxy, actually published as an early preview. Both the software and documentation are a work in progress, and although we already use it on various production servers, they may contain inaccuracies, typographical errors, huge mistakes and empty pages. We work hard to eradicate all mistakes and implement stuff, but it is a long and tedious process. We appreciate your patience and understanding. Of course, any help will be greatly appreciated.
Overview
The «Overview» tab shows agregated metrics about the system.
Top metrics shows a quick summary over the last 24 hours, graphs shows agregated statistics for the the selected time range.
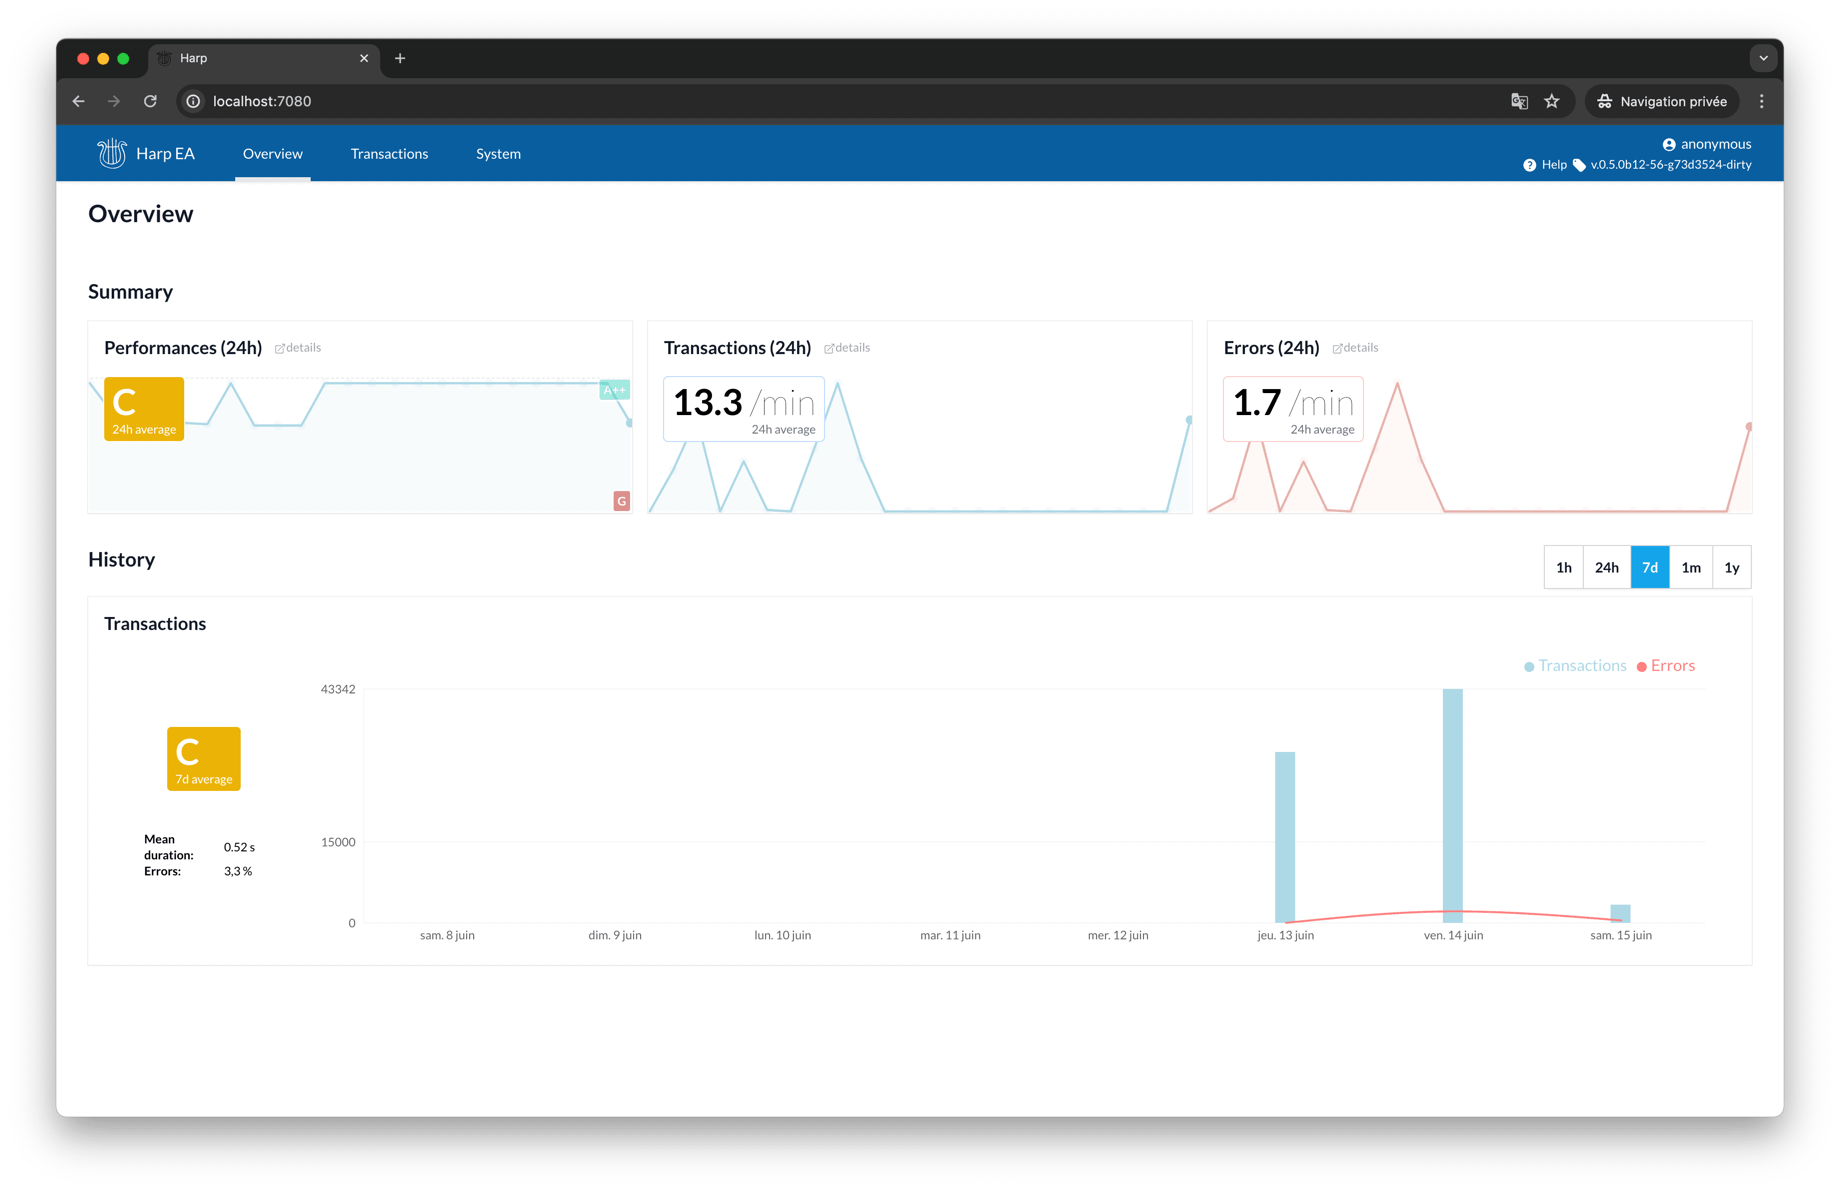
Performances: Average hourly performances of HTTP transactions, over the last 24 hours.
Transactions: Average hourly transaction count, over the last 24 hours.
Errors: Average hourly error count, over the last 24 hours.
Transactions Overview: Detailed transaction count and errors over the selected time range. If you have more than one endpoint, one graph per endpoint will be available too.
Todo
better screenshots